Lubricant analysis
Published over 11 years ago. See the latest and most current information on Lubricant analysis.
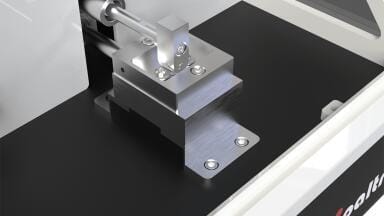
MCR tribometers offer a range of test strategies to determine the effect of additives on the friction and wear behavior of lubricants, such as:
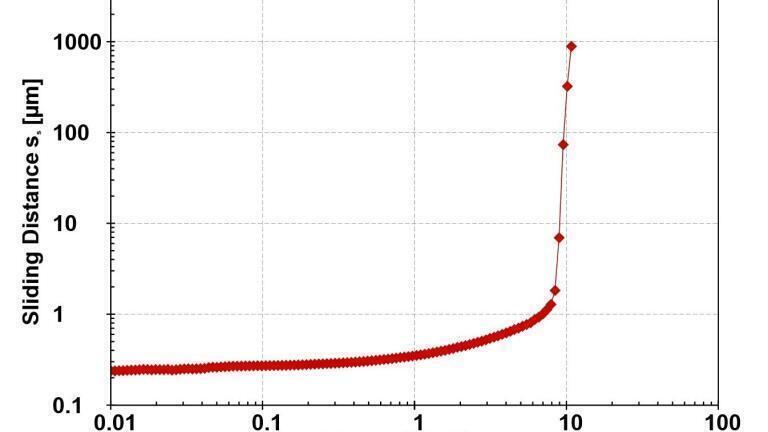
Coefficient of Limiting Friction (µs)
This refers to the magnitude of static friction at the onset of macroscopic motion. The high torque sensitivity of the MCR tribometers drive makes it possible to determine limiting friction with the utmost precision. In Figure 1, macroscopic motion occurs at a torque value of 9 mN.m (µs = 0.13). This is especially useful in understanding the start-stop behavior of tribological systems.
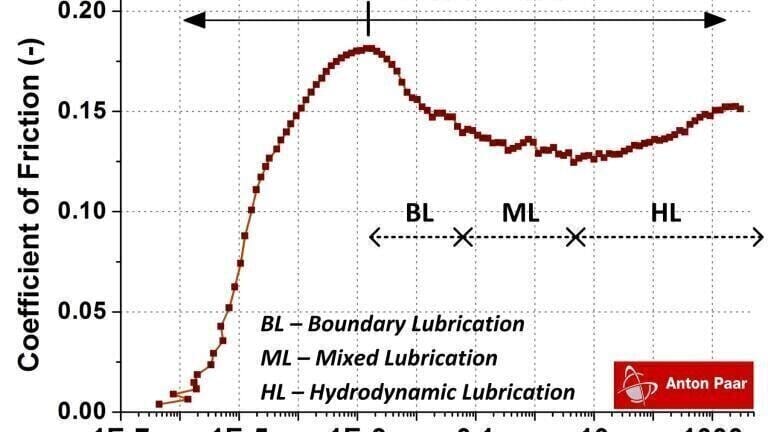
Stribeck Curves
MCR tribometers offer the unique possibility of plotting Stribeck curves over nine decades of rotational speed. As seen in Figure 2, the Stribeck curve extends beyond the conventional boundary lubrication regime into the region of static friction - all in one single measurement. These Stribeck curves help us understand the friction behavior of tribological systems right from their state of rest, through the initiation of motion, all the way across different lubrication regimes. Stick-slip behavior can also be studied with these tests.
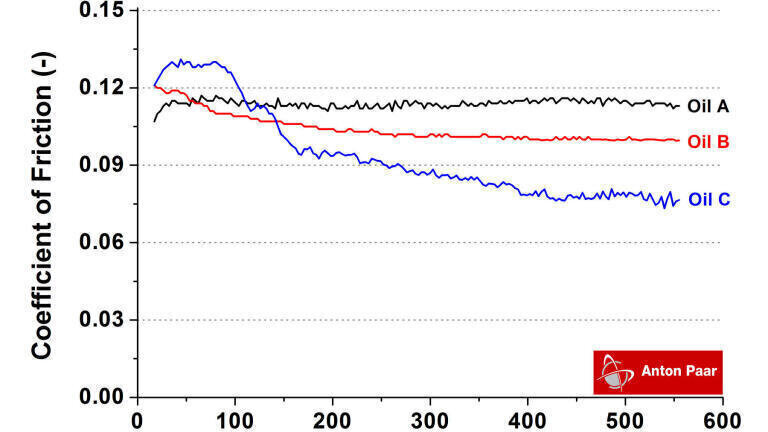
Long-term Wear Tests
Wear behavior of tribological systems can be examined over a longer period of time. At the end of the test, wear scar measurement of the specimen, along with the in-situ gap measurement from the MCR tribometers, offer substantial insights into the wear behavior of tribological systems. Figure 3 depicts evolution of friction over sliding distance for three different lubricants with slightly varying additive formulation. Wear scar measurements indicate highest wear for Oil C, which also has the lowest friction coefficient at the end of the test. Oil A has the lowest wear, which is attributed to the formation of tribofilms at the contact interface.
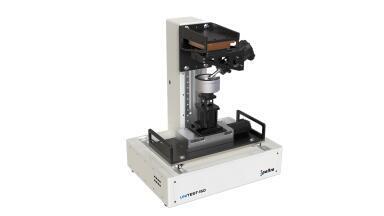
All the tests mentioned above, along with several others, can be run effortlessly with the help of the RheoCompassTM software which comes pre-loaded with a range of test templates. Each of these templates can of course be modified to suit your individual needs. Overall, you benefit from the extended tribological contact geometries offered by the MCR tribometers as well as the technical expertise of the specialists in this field who will gladly help you find the ideal solution for your testing needs.
PIN 27.3 June/July 2026


-(1).jpg)
2.jpg)
.jpg)
.jpg)