New GC Image Feature: Side-by-Side Comparison
Figure 2 - The Matched Markers Tab reports the marker blobs used to determine the alignment.
Figure 3 - The Spectra Tab displays side-by-side the spectra for any selected blobs of the two images.

Analytical instrumentation

New GC Image Feature: Side-by-Side Comparison

12 Dec, 2018

Published over 7 years ago. See the latest and most current information on Analytical instrumentation.

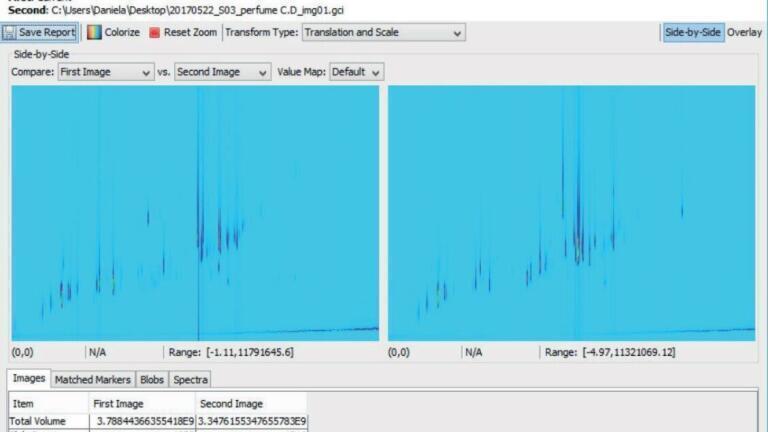
A new version of the GC Image software package released this year, GC Image v2.8, advances software capability and user-friendliness with improvements and new features. An example of newly-added functionality is the Compare Images - Side-by-Side tool. This new comparison interface displays two chromatograms next to each other for easy assessment of similarities and differences in the 2D patterns and allows interactive review of blob matching between the two images. (figure 1*)

Brief overview of added possibilities

The improved Compare Images tool now gives a wider selection of comparison modes. Upon loading the reference image, this is now automatically displayed next to the current image. The user can still create differential images (difference, flicker, etc.) like in the previous software versions, and in addition a transparent overlay of the two images, to show the smallest pixel by pixel differences.

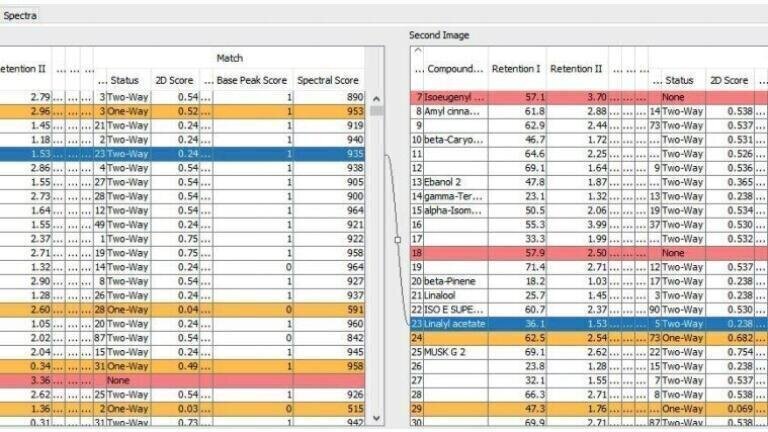
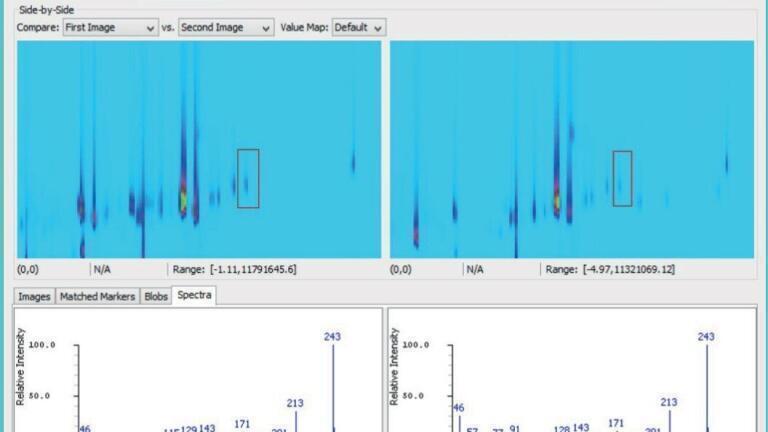
In addition to these graphic options, the side-by-side functionality allows peak-based comparison using both chromatographic and spectral information. Initially each chromatogram is processed individually to detect, identify, and quantify blobs. User-identified peaks are used as alignment markers to match all blobs in the two images. The side-by-side window allows reviewing the chromatograms, enables comprehensive peak matching and automates difference detection.

A set of tables provides quantitative comparison statistics:

  • The Matched Markers Tab reports the marker blobs used to determine the alignment. (figure 2*)
  • The Blobs Tab shows blob tables along with properties and matching scores. A link is shown between the selected matched blobs in the two images to signify correlation. A colourisation system gives an overview of the blob status: white blobs are matched bi-directionally, orange indicates a match with conflicting identification and red unmatched blobs unique for one image
  • The Spectra Tab displays side-by-side the spectra for any selected blobs of the two images. (figure 3*)

Conclusions

  • The new side-by-side comparison tool makes samples comparison easier and more effective.
  • Capability is extended from comparative visualisation to characterisation down to individual blobs.
  • The user can perform direct MS comparison for peaks of interest.
  • The automatic, colour-based classification helps to identify recurring peaks and selective markers.

Want to know more about GC Image or the latest version? Click here.

Author application note: Daniela Peroni, JSB© 2018

PIN 27.2 Apr/May 2026

Explore our Digital Edition

Discover the latest news and research

Digital edition

Explore Our Other Sites

Labmate Online
Pan-European One Health network targets infectious disease threats
Explore more Arrow
Envirotech Online
Rack-mountable FTIR gas analyser for integrated multi-gas analysis in fixed measurement systems
Explore more Arrow
Pollution Solutions Online
Queen’s University Belfast leads £2.9 million international project to combat Malaysia’s growing e-waste crisis
Explore more Arrow
Chromatography Today
Chromatography and XFEL imaging reveal critical point behind water’s behaviour
Explore more Arrow