Analytical instrumentation
Published over 10 years ago. See the latest and most current information on Analytical instrumentation.
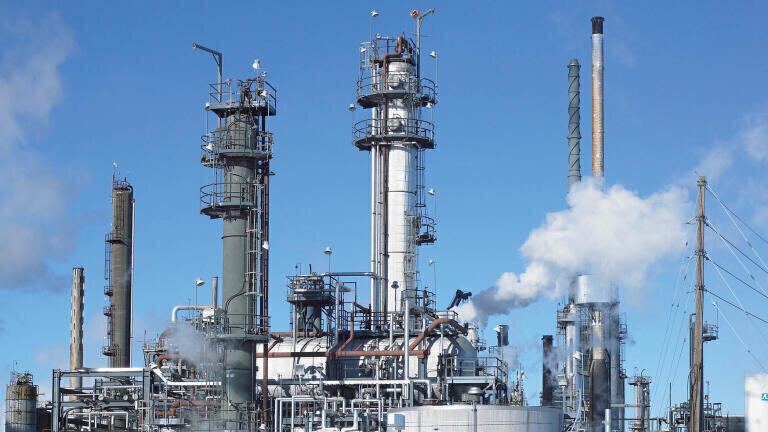
Matrix effects, or differences between the elemental composition of test samples and the calibration standards, can often result in biased chlorine measurements. These effects can be compensated for with the utilization of one of two methods. First, the selection of calibrants that match—as closely as possible—the test sample matrix. This is especially true for materials containing oxygen, for instance E85 (85% ethanol in gasoline). The closer the calibration matrix reflects the actual test samplers, the better the results will be. Secondly, one can employ the use of a matrix correction factor. Commonly used in the refining industry, users will typically apply a matrix correction factor for measurement of aqueous samples on a hydrocarbon based calibration curve.
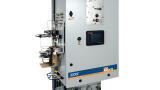
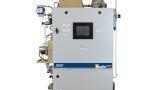
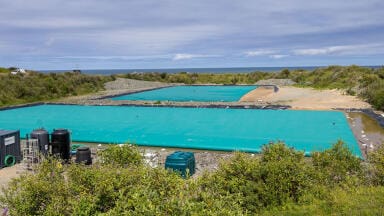
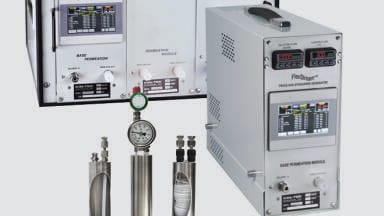
In this procedure, the analyst will pipette 5-8 ml of sample into a sample cup and test in the XOS (USA) Clora using Etnom XRF film. The standard analysis time for samples containing >1 ppm chlorine is 300 seconds. If the sample contains <1 ppm chlorine, a 600 sec measurement time is suggested for optimal results. In addition, if the sample contains >1 wt% sulphur, use of a sulphur correction table is recommended help improve results. If a water-based calibration curve is used when measuring aqueous samples, a matrix correction factor is not needed. When the aqueous sample is measured on a hydrocarbon curve, high oxygen content, when not accounted for, will result in reduced counts and a falsely low chlorine value. If a dedicated water curve has not been developed, multiply the results obtained using a hydrocarbon calibration curve by 250% (or 2.50).
In Summary:
Total chlorine of aqueous samples measured on water based calibration curve: Total chlorine (ppm) = measured chlorine
Total chlorine of aqueous samples measured on hydrocarbon based curve: Total chlorine (ppm) = 2.5 * measured chlorine
PIN 27.3 June/July 2026

-(1).jpg)


-(1).jpg)

-(1).jpg)