Analytical instrumentation
Published over 15 years ago. See the latest and most current information on Analytical instrumentation.
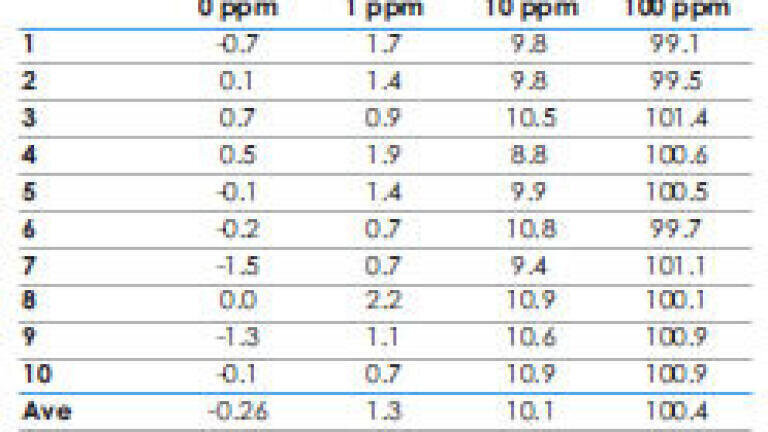
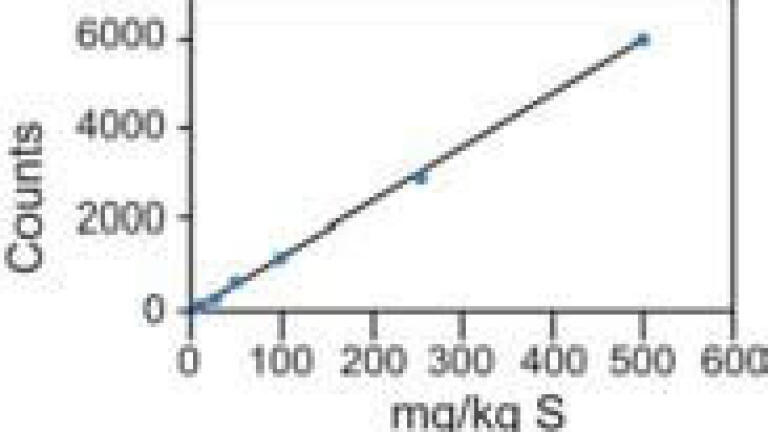
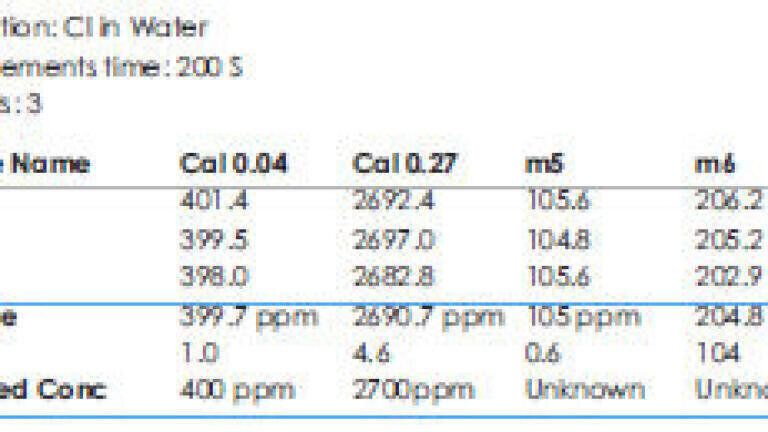
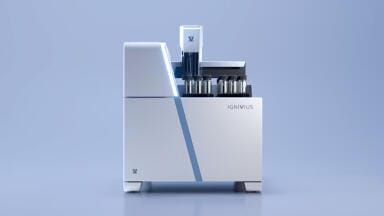
The new MESA-6000 by HORIBA Scientific is able to perform high sensitivity analysis of both Sulphur and Chlorine on the same instrument. Only one sample needs to be prepared, and it will be measured using the selected calibration curve. The customer is able to create and store as many calibration curves as he wants. Figure 1 shows a calibration curve made for Sulphur up to 500 ppm. On Table 1, some typical results obtained with this calibration curve are reported. To evaluate the standard deviation, 10 replicates have been done on each sample. With exactly the same simple operations, it is possible to build calibration curves for Chlorine. Some waste waters samples results are presented in Table 2. The standard deviations are excellent at all levels including very high concentration.
PIN 27.3 June/July 2026


-(1).jpg)
2.jpg)
.jpg)