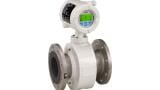

Viscometer
If you’ve ever tried to compare viscosity readings from a lab with what you see in an actual production line, you will know they rarely line up perfectly. That’s not because one of them is wrong, it’s because they are measuring under totally different conditions.
In the lab, viscosity is typically measured at a fixed temperature and under very controlled, low shear conditions. In industrial processes, nothing is that stable. Temperatures fluctuate, shear conditions change constantly, and many products, especially non-Newtonian fluids like slurries, polymers, or complex formulations, don’t behave consistently.
So, what you often end up with is a useful lab number… and a process number that doesn’t quite match it. And that mismatch makes tight process control much harder than necessary.
SOFRASER’s approach is essentially about bringing those two worlds back into alignment.
The first part of the solution is Temperature Compensated Viscosity (TCV). In simple terms, it adjusts viscosity readings, so they relate back to a standard reference temperature. That matters because even small temperature changes can shift viscosity significantly, sometimes giving the impression that the process is changing when it is really just the temperature doing the work. TCV helps remove that issue.
The second part is correlation, which tackles a different problem: shear differences. What a fluid does in a controlled lab test is not always the same as when it is flowing through a pipe or reactor. Correlation helps map the real-world measurement back to lab conditions, so operators are comparing like with like.
Used together, these two methods mean you can get a process viscosity value that matches laboratory expectations, without having to stop the process and take samples
This isn’t a theoretical correction taken from a spreadsheet. It is built directly into SOFRASER’s instrumentation.
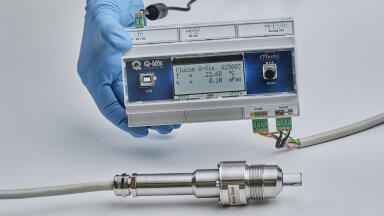
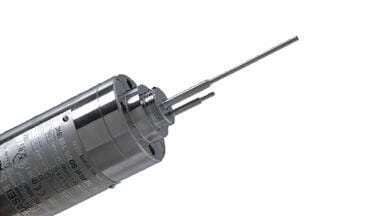
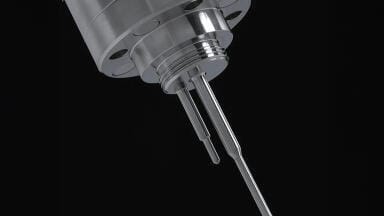
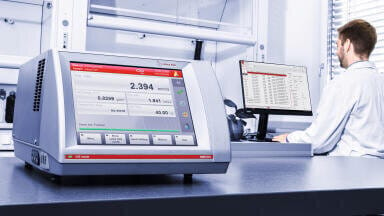
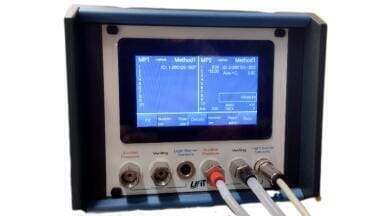
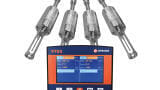
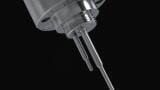
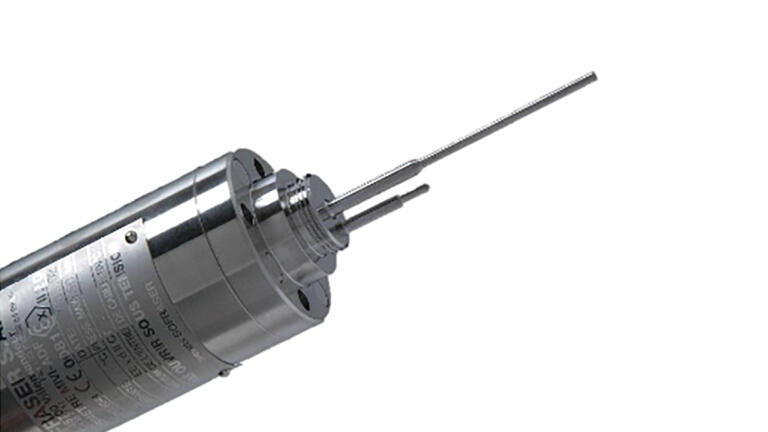
The MIVI viscometer continuously measures both viscosity and temperature. That data is then handled by the 9710 processor, which applies temperature compensation and correlation in real time. The output can be fed straight into control systems using standard industrial signals like RS485 or 4–20 mA.
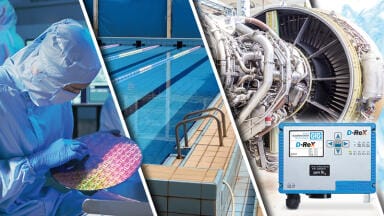
Because everything happens live, operators have a continuous picture of how the product is behaving, rather than occasional snapshots from lab tests. The system can be installed inline, online, or on a reactor, and works across both batch and continuous processes.
At its core, this approach makes viscosity data more usable. Instead of juggling differences between lab and process readings, operators get one consistent view they can trust for control decisions.
That means fewer surprises, less reliance on manual sampling, and a more stable, predictable process, especially in applications where product consistency really matters.
PIN 27.3 June/July 2026

-(1).jpg)