.jpg)
Laboratory products
Rheological testing provides quantitative, objective metrics for food quality control (QC) that complement or replace empirical methods such as Bostwick consistometers and texture analysers. This article surveys rotational and oscillatory measurement techniques applicable to dairy products, plant-based alternatives, confectionery, and beverages. Drawing on published application studies, it presents QC-ready test protocols, discusses geometry selection, temperature control, and acceptance-criteria development, and highlights common pitfalls. A practical implementation checklist is provided for laboratories establishing rheological QC programs.
Consumer expectations for food products are anchored in properties like texture and spreadability. A yogurt must be spoonable yet creamy, chocolate must melt smoothly on the palate, hazelnut cream must spread without tearing bread, and a plant-based cooking cream must pour and thicken like its dairy counterpart. Behind each of these attributes sits a measurable rheological property: yield stress, shear-thinning behaviour, viscoelastic moduli, or structural recovery after shear.
But what exactly is rheology, and why does it matter for quality control? In simple terms, rheology is the science of how materials deform and flow under applied forces. Every time you squeeze ketchup from a bottle, spread butter on toast, or stir a sauce, you are experiencing rheological behaviour. In a production context, the same physics govern how a product is pumped through pipes, how it pours from a filling nozzle, how it sits on a shelf without separating, and how it feels in the consumer’s mouth.
Traditional QC relies on empirical tools: the Bostwick consistometer for sauces, the Zahn cup for coatings, or subjective panel scoring for mouthfeel. These methods are fast and familiar but suffer from poor resolution, operator dependence, and an inability to separate elastic from viscous contributions. A Bostwick reading, for instance, conflates yield stress with viscosity at an uncontrolled shear rate; it tells you something changed, but not what or why.
Modern rheometers impose a defined shear or oscillatory deformation and measure the resulting stress (or vice versa), providing physical quantities in SI units (e.g., viscosity in Pa·s, moduli in Pa, and yield stress in Pa). Comparable results require controlled temperature, a defined geometry, and a verified SOP. This article condenses findings from a series of food-rheology application studies into a practical framework for implementing rheological QC in food production.
Linking rheological tests to QC needs
The first step in any rheological QC program is mapping the product attribute of interest to the correct test type. Before investing in method development, a QC manager should ask, “What property do I actually need to control?” Table 1 provides this mapping. In everyday terms: If the complaint is “the cream doesn’t pour properly,” a flow curve is needed.
If the hazelnut cream is too stiff at application temperature, a yield-stress test can help to find the answer. If a chocolate milk separates on the shelf, an amplitude sweep or 3ITT assesses structural stability at rest.
Table 1: QC use-case map for rheological testing.
Rheological test What it measures Product attribute
Flow curve (shear rate ramp) Viscosity η vs. shear rate γ ̇ Pourability, pumpability, coating thickness
Yield-stress determination Yield stress τ₀ (Pa) Spreadability, sag resistance, shape retention
Amplitude sweep (oscillatory) G′, G″ vs. strain Gel strength, structural integrity, stability
Temperature sweep (oscillatory) G′, G″ vs. T Melting/gelation behaviour
3-Interval thixotropy test (3ITT) Recovery after high shear Structural recovery, sedimentation tendency
Viscosity profile (pasting curve) Viscosity η vs. time at T-profile Protein functionality, denaturation onset
All source studies used Anton Paar rheometers with Peltier or electrical temperature control and can be executed on an MCR with the corresponding geometries. The choice of measuring geometry is critical and driven by sample properties:
• Concentric cylinders are often used for pourable liquids and semi-solids. Sandblasted variants reduce wall slip with fatty samples such as chocolate.
• Double-gap geometries are required for very-low-viscosity samples, such as plain milk, where the enlarged shear area improves torque resolution.
• Parallel plates are necessary for stiff or solid-like samples like ice creams or meat analogues. Profiled plates prevent the sample from slipping.
• Stirrer systems are ideal for in-cup measurement of yogurt and sour cream. The stirrer is immersed directly into the original product cup, avoiding pre-shear artifacts from sample transfer – a significant advantage when measuring the product “as it is”.
Temperature control deserves special attention. An ice cream study demonstrated that an enclosed Peltier hood minimises thermal gradients. Without it, measured G′ and G″ values are substantially lower and melting details can be smoothed out. For measurements above 100°C (e.g., in protein denaturation studies), a pressure cell prevents water evaporation. Even at room temperature, a solvent trap or guard oil on the exposed sample rim is recommended for longer measurements, especially at elevated temperatures or low viscosities.
Table 2 lists recommended QC outputs and typical pitfalls. Detailed settings are given in the cited application reports.
Table 2: Method card for food QC testing.
Protocol Geometry Temp. Key output Potential error
Viscosity curve; chocolate [5] CC27 40.0°C ± 0.1°C Casson yield stress τ₀; infinite viscosity η_inf T drift >0.2°C; incomplete pre-shear
Yield stress; dairy [1] Stirrer in original cup ~22°C τ₀ by tangent-crossover Sample pre-disturbed; cup off-centre
Flow curve; hazelnut cream [6] Stirrer or CC27 15/25/
35°C Viscosity at ref. γ ̇; yield stress Insufficient T quilibration; fat changes during wait
Amplitude sweep; plant-based cream [2] CC27 5°C,
23°C G′ in LVE range; flow stress at G′/G″ crossover Loading destroys gel structure; gap too large
3ITT; plant-based cream [2] CC27 5°C, 23°C Recovery % at 2 s and 190 s after shear High-shear interval too short to fully decompose
Temp. sweep; ice cream [4] PP25 (profiled) -20°C to +10°C G′, G″ vs. T; slope in melting region No Peltier hood; irregular sample disc
Depending on the test, key reporting quantities include: viscosity at defined shear rates; yield stress via Casson or Herschel-Bulkley model fits; storage modulus G′ in the linear viscoelastic (LVE) range as an indicator of gel strength; loss factor tan δ = G″/G′ indicating the balance between viscous and elastic character; recovery percentage from a 3ITT; and characteristic values from temperature sweeps such as the G′/G″ crossover.
Each metric requires defined acceptance limits. A baseline study of 20 to 30 production batches established the process mean and natural variation. Control-chart methodology (X̄/R or X̄/s charts) then sets warning limits at ±2σ and action limits at ±3σ, transforming a measurement into a practical go/no-go production tool.
Before deployment, repeatability should be confirmed (target CV < 5%). The dairy study reported 3% CV for sour cream but 10 % for yogurt (n = 5 each). The higher value was attributed to sample inhomogeneity, not instrument error, meaning the remedy is better sampling, not a better rheometer. For multi-site deployment, a gauge R&R study should show measurement-system contribution below 10% of total tolerance. Temperature is nearly always the dominant sensitivity factor: Chocolate viscosity shifts 5% to 10% per °C, making ±0.1°C control essential.
Dairy: Yield stress distinguishes product firmness
Yield-stress measurements on yogurt and sour cream, performed with a stirrer immersed directly in the original product cups at ~22°C, gave 102 ± 9 Pa and 888 ± 20 Pa, respectively (tangent-crossover method). The maximum-deviation method agreed within 5% (97.2 ± 4 Pa and 883 ± 18 Pa). The nearly 10-fold difference reflects what any consumer would confirm: Sour cream has a much firmer structure and requires substantially more force to flow. For QC, yield stress is a meaningful discriminator between product grades, and small formulation changes will be detectable as shifts in this metric.
Figure 1: CSS test of yogurt (red curve) and sour cream (green curve), with the yield points determined by the tangent crossover method (orange dots) and the maximum deviation from the fitting line method (blue dots).
Three chocolate types measured at 40°C showed clear differences. Bittersweet chocolate had the highest Casson yield stress (35.1 Pa) and infinite viscosity (4.6 Pa·s), followed by white (17.1 Pa / 2.8 Pa·s) and milk (14.0 Pa / 1.6 Pa·s). These values directly control enrobing thickness, moulding behaviour, and mouthfeel. A shift in yield stress typically signals a change in cocoa-butter crystallisation or emulsifier distribution, exactly the kind of root cause that a QC system should flag early.
Figure 2: Viscosity of different chocolate samples as a function of shear rate.
Soy-, oat-, and coconut-based cooking creams were compared with dairy cream at 5°C and 23°C using a combination of tests. Viscosity curves showed all plant-based samples exhibit stronger shear-thinning behaviour than dairy cream. This is advantageous for processing but means that single-point viscosity can be misleading.
Amplitude sweeps revealed gel-like structures (G′ > G″ at rest) for the soy and oat creams, but fluid-like behaviour (G″ > G′) for the coconut variant – a structural difference invisible to a simple viscosity measurement. The 3ITT showed dairy cream recovers fastest: 96% after just 2 s at 5°C, versus 77% to 85% for the plant-based alternatives. After 190 s, all products exceeded 90% recovery, though dairy cream reached 100 % while coconut-based cream reached only 92%. For QC specifications, this inherent product difference must be accounted for; the same recovery threshold cannot apply to dairy and plant-based products.
Figure 3: Samples characterised using a CC27 measuring geometry. Due to its very low viscosity, dairy-based cream was measured using a double-gap measuring geometry.
Figure 4: Samples characterised using a CC27 measuring geometry at 5°C.
Figure 5: Temperature sweep (TS) of an ice cream under different processing conditions.
Ice cream temperature sweeps (-20°C to +10°C at
0.5 K/min) revealed three distinct rheological regions that map onto sensory attributes: rigidity and scoopability below -10°C, coldness perception between -10 and 0°C (steeper G′ slope = more coldness),
and creaminess above 0°C (higher G″ = creamier). Different processing methods produced measurably different samples, demonstrating that the test can discriminate process variants affecting sensory quality.
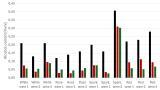
A German and Croatian formulation of the same branded hazelnut cream were compared at three temperatures. The Croatian variant had consistently higher yield stresses: 285 Pa vs. 228 Pa at 15°C, 178 Pa vs. 137 Pa at 25°C, and 132 Pa vs. 104 Pa at 35°C.
Notably, the German product at 25°C has comparable viscosity to the Croatian product at 35°C, meaning the German version is easier to spread at typical temperatures. This provides rational, quantitative evidence for regional recipe adaptation rather than relying solely on subjective panel assessments.
Figure 6: Viscosity of German and Croatian hazelnut cream at different shear rates and temperatures.
Figure 7: Viscosity of German and Croatian hazelnut cream at different shear rates and temperatures.
From data to decisions
Rheological data becomes QC-actionable when translated into pass/fail criteria. A hazelnut cream might specify a yield-stress window of 130 Pa to 180 Pa at 25°C (lots below are too runny, lots above are too stiff to spread).
Trending yield stress on a control chart over weeks reveals drift (e.g., a gradual shift in fat-blend composition from a supplier change before the product falls out of specification). For the 3ITT, a practical specification might require ≥80% recovery after 2 s for plant-based creams, or ≥90 % for dairy cream. For chocolate, the IOCCC 2000 protocol provides an industry-recognised framework.
Wall slip: Fatty or particulate samples can slip at the geometry surface rather than shearing within the bulk, producing erroneously low viscosity readings. Sandblasted or profiled geometries mitigate this, but operators should verify that results do not change when switching between smooth and roughened surfaces.
Shear history: Many food products are thixotropic, meaning their viscosity depends on their entire mechanical history. Standardised pre-shear or rest intervals are mandatory in any SOP. The stirrer-in-cup approach for dairy avoids one common source of uncontrolled pre-shear.
Temperature: Temperature control is not optional but necessary to gain reliable results. The viscosity of chocolate can shift 5% to 10% per °C, for example, while ice cream moduli span five orders of magnitude over 30°C.
Sample heterogeneity: Yogurt showed 10% CV due to inherent variability. The remedy is better sampling (e.g., more replicates, defined sampling position), not a more precise instrument.
Time-dependent effects: Pudding gels upon cooling and proteins denature irreversibly. Every measurement must be time-stamped relative to a defined starting condition.
Rheometry adds clear value when (a) the attribute has both elastic and viscous components, (b) temperature dependence must be mapped continuously, (c) specifications must transfer between sites with different instruments, or (d) root-cause analysis requires separating individual structural contributions.
Rotational rheometry provides food QC laboratories with physically meaningful, SI-traceable metrics like viscosity, yield stress, viscoelastic moduli, and structural recovery. This directly relates to product attributes perceived by consumers and required by process engineers. The key to successful implementation lies not in the instrument alone, but in rigorous method design: defined geometry, temperature, shear history, equilibration, and acceptance criteria derived from baseline studies.
QC implementation checklist:
1. Define the target attribute (spreadability, pourability, stability) and select the corresponding test type.
2. Choose geometry and temperature based on sample properties and the relevant use condition (storage, body, or process temperature).
3. Develop a written SOP covering sample preparation, loading, trimming, equilibration, measurement profile, and data analysis.
4. Run a baseline study (≥20 batches) to establish mean and natural variation of the chosen metric.
5. Set acceptance limits using control-chart methodology (±2σ for warning, ±3σ for action).
6. Validate repeatability (target CV < 5%) and perform gauge R&R for multi-operator or multi-site deployment.
7. Control temperature rigorously: ±0.1°C for chocolate and high-sensitivity applications and ±0.5°C for most other products. Use a Peltier hood for sub-ambient measurements.
8. Use slip countermeasures like sandblasted or profiled geometries for fatty, particulate, or stiff samples.
9. Trend all results on control charts to detect drift before out-of-specification events occur.
10. Review the method annually, or whenever formulation, supplier, or process changes occur.
1. Application Report C04IA026EN-C, ‘Yield Point Determination of Dairy Products’.
2. Application Report C92IA079EN-A, ‘The Flow Behavior of Plant-Based Cooking Cream’.
3. Application Report C92IA018EN-C, ‘Milk Drinks: Rheological Tests for Determining the Separation Stability of Low-Viscosity Dispersions’.
4. Application Report C92IA011EN-B, ‘Rheological Characterization of Ice Cream’.
5. Application Report D56IA001EN-B, ‘Chocolate! How Does It Melt and Flow?’
6. Application Report C04IA031EN-C, ‘Temperature-Dependent Spreadability of Hazelnut Cream’.
7. Application Report B84IA013EN-A, ‘Plant-Based Drinks, Pudding and Pressure’.
8. Application Report D56IA004EN-B, ‘Rheological Tests on Milk Drinks’.
9. Application Report C92IA076EN-A, ‘The Rheology of Plant-Based Meat Alternatives’.
PIN 27.2 Apr/May 2026


.jpg)