Analytical instrumentation
Published over 6 years ago. See the latest and most current information on Analytical instrumentation.
If you’ve been following VUV Analytics for a while, you are probably no stranger to Time Interval Deconvolution or TID™ for short. For those new to the concept, Time Interval Deconvolution is an alternative methodology for quantitating chromatographic data. Traditional chromatographic quantitation methods using both analog (e.g., FID, TCD) and spectral (e.g., mass spec) detectors integrate area under peaks to determine concentration. While this approach is fine for well separated peaks, any significant coelutions must be addressed by arbitrarily splitting the two (or more) peaks at a certain point, cutting off a non-trivial amount of each peak.
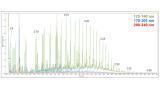
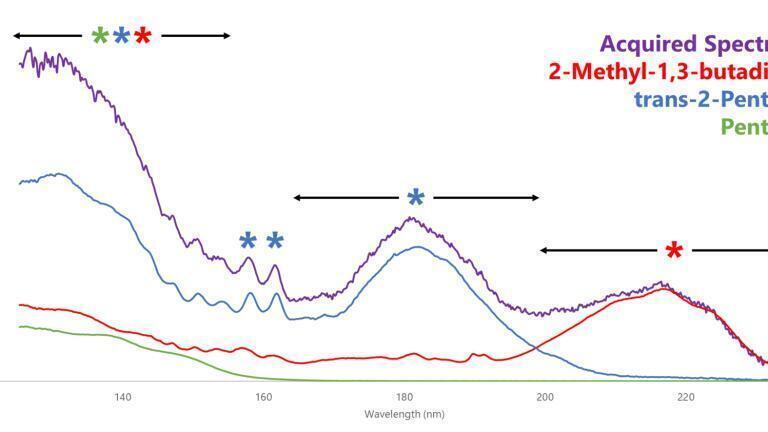
VUV Analyze™ Software, equipped with Time Interval Deconvolution, attacks this challenge by not relying on peak integration but instead uses a third dimension of data – the VUV absorbance spectra. And this is where TID comes into play: regardless of the acquisition frequency, the absorbance spectra is summed for a given time interval and the spectrum is then matched to the reference spectra within the VUV reference library. Sometimes the acquired spectrum will match perfectly to one of the library spectra; other times a single-analyte match won’t cut it, and so the software will search for the best multi-analyte combination (Figure 1). Either way, the total spectral response of each contributing analyte is banked. Once all the time intervals have been matched and the total responses banked, the relative response factors and densities are used to convert those responses to a relative mass % and/or volume %. Check out this quick demonstration of TID in action using VUV Analyze Software.
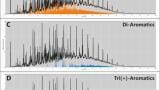
So how is this technology applied to methods like ASTM D8071 (Gasoline), ASTM D8267 (Jet Fuel), or VHA™? Once the total response for each library compound found in the chromatogram is bucketed, that data can then be reported in any way the application calls for. For a method like D8071 where the focus is classing by hydrocarbon type (i.e., PIONA), everything is assigned to one of those five categories first and foremost; from there, several individual species are called out and speciated. VHA on the other hand is a more stringently controlled method from a quantitative standpoint with additional confidence in speciated data since it includes more precise time windows for individual compounds. For D8267 broader categories like saturates, mono-aromatics, and di-aromatics are what is important, and TID is what makes this application a possibility since good chromatography with jet fuel is very difficult; additionally, the mono- and di-aromatics can be summed to give us total aromatics.
How can TID save you time and energy in your data analyses? What other applications could use the power of TID? Contact VUV Analytics to find out more!
References
†LCGC Blog from Kevin Schug on June 1, 2017
By Alex Hodgson
PIN 27.3 June/July 2026

-(1).jpg)


-(1).jpg)
-(1).jpg)