Measurement and testing
Published over 3 years ago. See the latest and most current information on Measurement and testing.
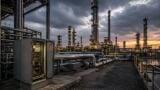
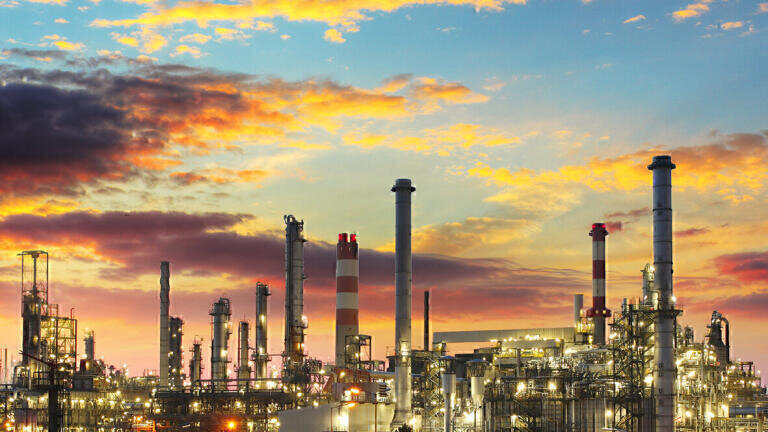
Methane is a powerful greenhouse gas and several organizations in multiple countries are taking significant steps toward sharply reducing emissions from the oil and gas sector [1] [2]. According to EPA (United States Environmental Protection Agency), methane accounts for 10% of total greenhouse gas emissions whereas carbon dioxide amounts to 80% [3]. However, the fact that methane has a global warming potential that is 28–36 times that of carbon dioxide over a 100-year period (IPCC’s Fourth Assessment Report [4]) is a strong motivation for reducing emissions. A large portion of the methane emissions come from the energy sector, more precisely from natural gas and petroleum industry. The oil and natural gas industry includes a wide range of operations and equipment, from wells to natural gas gathering lines and processing facilities, to storage tanks, and transmission and distribution pipelines, all of which can leak methane into the atmosphere.
Recent work from Duren et al. and Frankenberg et al. indicate that a small number of point sources (10%) are responsible for most (60%) of the methane emissions [5] [6]. These sources are called super-emitters. Several technologies exist to detect those emissions. Airborne longwave infrared hyperspectral imager like the Hyper-Cam Airborne Mini is one of them. This technology was evaluated and its capabilities demonstrated in multiple methane-controlled releases. In this work we want to present a comprehensive summary of the detection and quantification results obtained in recent campaigns.
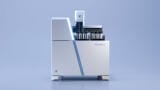
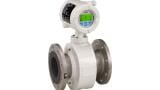
The Methane Airborne Detection Solution is based on FTIR (Fourier Transform Infrared) hyperspectral imaging technology. The camera named Hyper-Cam Airborne Mini can be installed in drones, aircrafts and helicopters (Figure 1). It provides a high spatial resolution infrared image. Its 320×256-pixel cooled infrared detector also ensures excellent 2D image quality. The most recent version of the system provides an instantaneous field of view (iFOV) of 750 μrad per pixel. This, for example, translates to a footprint of 0.23 m and 0.3 m for height above ground level (AGL) of 305 m (1000 ft) and 396 m (1300 ft) respectively.
The system comes complete with an optical head composed of the hyperspectral camera, a GPS and inertial measurement units to record the position and orientation of the sensor along with a processing unit, and powerful software suite for commands, controls, and data processing. The hyperspectral imager offers a user selectable spectral resolution down to 0.5 cm-1. For the results presented in this paper, spectral resolutions used ranged between 4 to 11 cm-1. These spectral resolutions settings offer a great compromise between acquisition frame rate and signal to noise ratio for methane detection. In addition, the system delivers very high-resolution visible imagery with 12 megapixels embedded camera. This system is capable of surveying roughly 13 square kilometers (5 square miles) of oil and gas infrastructure per hour making it a very efficient system.
Results presented in this paper come from 4 different airborne data collection campaigns at various locations. Included in this list are the campaign over Total’s TADI plateforme in Lacq, France in 2018 [7] and the one performed with ASMAN Technology and GRTgas over the Jonzac-Neules aerodrome in 2021 [8]. For confidentiality reasons, the 2 other locations cannot be disclosed. For all these tests, methane was release from high pressure canisters and measured with quality flow meter. For the vast majority of the campaigns, wind speed was measured locally with a weather station deployed near the methane release point. For all cases, the flight altitudes varied between 305 m and 1200 m.
For each of the detections, a detection report is produced in graphical and table format. The graphical report file contains the detection image as it appears in the software used when taking measurements, consisting of the broadband infrared image overlaid with the color-coded detection results. Figure 2 shows an example of a methane gas plume detected during the campaign with ASMAN Technology and GRTgas over the Jonzac-Neules aerodrome. In addition to the individual reports, the system can provide a georeferenced map of the data acquired in mapping mode, see Figure 3.
The gas leak rate or flux can be calculated ([9], [10]) using both the gas mass per area and the mean gas flow velocity. The gas flow velocity is taken to be the local wind velocity as measured by a weather station deployed at the gas release site. To illustrate the procedure, data from test case presented above (Figure 2 and Figure 3) are used. From the specifics of the Hyper-Cam (iFOV and AGL) and the path length concentration results (Figure 4), the total methane mass contained within a specified area of the image (red rectangle in Figure 4) is calculated. Multiplying the total methane mass within the chosen area of interest by the wind velocity (2.4 m/s for this dataset) leads to retrieved flux value of 12.7 m3/h. This is in good agreement with the released gas flux of 13 m3/h.
Figure 5 presents the retrieved leak rate values for positive detections during the 4 controlled methane release campaigns. In the summary graph, there are 78 datapoints from a commanded release rate of 3 m3/h to 54.8 m3/h. Results show a strong correlation between the calculated leak values and the commanded leak rate values.
Plume quantification accuracy depends on the wind measurement accuracy, the fit of the results show a parity slope of 0.99 with an R2 of 0.89. The obtained results seem to indicate that the detection limit of the system would be around 3 m3/h (1968 g/h or 2543 ft3/day) of methane. However, this limit depends on the atmospheric conditions which prevailed during the tests and the parameters of the system. For this system, based on infrared hyperspectral technology, the detection limit depends on several parameters such as thermal contrast, cloud cover, gas concentration, AGL, wind conditions and humidity level.
Results from multiple recent methane-controlled release experiments show very good agreement between commanded leak rate and measured leak rate using wind data from weather stations deployed near the release site.
Based on the results collected during these tests, the Hyper-Cam Airborne Mini is a highly efficient and sensitive tool for the detection and quantification of methane leaks. The real-time reporting capability is an important advantage allowing rapid decisions for critical situations.
[1] EPA Proposes New Source Performance Standards Updates, Emissions Guidelines to Reduce Methane and Other Harmful Pollution from the Oil and Natural Gas Industry
https://www.epa.gov/controlling-air-pollution-oil-and-natural-gas-industry/epa-proposes-new-source-performance.
[2] Canada confirms its support for the Global Methane Pledge and announces ambitious domestic actions to slash methane emissions
https://www.canada.ca/en/environment-climate-change/news/2021/10/canada-confirms-its-support-for-the-global-methane-pledge-and-announces-ambitious-domestic-actions-to-slash-methane-emissions.html.
[3] EPA website (https://www.epa.gov/ghgemissions/overview-greenhouse-gases).
[4] IPCC’s Fourth Assessment Report - Errata (IPCC 2012) (https://www.ipcc.ch/report/ar4/wg1/).
[5] Duren, R.M., Thorpe, A.K., Foster, K.T. et al. California’s methane super-emitters. Nature 575, 180–184 (2019).
[6] Frankenberg, C. et al. Airborne methane remote measurements reveal heavy-tail flux distribution in Four Corners region. Proc. Natl Acad. Sci. USA 113, 9734–9739 (2016).
Examples of reference formats are given here. For additional information on formatting references, refer to the ACS Style Guide, edited by J.S. Dodd (American Chemical Society, Washington DC, 1986).
[7] Watremez, Xavier & Baron, Thierry & Marble, Andre & Veronique, Miegebielle & Marcarian, Xavier & Foucher, Pierre-Yves & Cézard, Nicolas & Raybaut, Myriam. (2020). Validation of Innovative Systems of Remote Gas Leaks Detection and Quantification Reducing Emissions and Increasing Safety. 3825-3828. 10.1109/IGARSS39084.2020.9323685.
[8] Gagnon, Jean-Philippe & Guyot, Éric & Matysiak, Éric. (2022). Airborne Quantification of Methane Emissions for Alternative Leak Detection and Repair (LDAR). OPTRO Conference 2022.
[9] X. Watremez, N. Labat, G. Audouin, B. Lejay, X. Marcarian, D. Dubucq, A. Marblé, P-Y Foucher, L.Poutier, R. Danno, D. Elie, M. Chamberland, “Remote Detection and Flow rates Quantification of Methane Releases Using Infrared Camera Technology and 3D Reconstruction Algorithm”, SPE Annual Technical Conference and Exhibition, november 2016. DOI: 10.2118/181501-MS.
[10] P-Y. Foucher, S. Doz, J.P Gagnon, M. Chamberlain, X. Watremez, “ Real time Airborne Gas quantification using Thermal Hyperspectral Imaging : Application to methane. “, Remote Sens, 2019 Special Issue Imaging Spectroscopy Avancements in Understanding Earth System submitted.
PIN 27.3 June/July 2026