Analytical instrumentation
Published over 6 years ago. See the latest and most current information on Analytical instrumentation.
Over the years, refineries have fine-tuned their production methods to maximize efficiency while ensuring quality. One such example is an increase in the use of catalysts which speed up reactions as crude oils continue to work their way toward becoming finished products. As the use of catalysts became more commonplace, refineries quickly realized that these reaction-inducing substances were rapidly deactivating due to the naturally occurring metals commonly found in crude oil. To mitigate this, refinery labs are assessing the content of metals in crude oil to ensure that catalyst fouling is kept to a minimum, leading to significant savings. However, there is an additional aspect to assessing catalyst efficiency in the form of chlorine.
In addition to keeping catalyst fouling under control, refiners are also challenged with determining the lifespan of the catalysts. As chlorine content rises, the lifespan of the catalyst shrinks. Therefore, one can determine how long their catalysts can be
used before becoming spent or needing regeneration by monitoring the chlorine concentration rise over time. Essentially, refiners can optimize their catalyst quality by measuring metals in crude, and then assess the payoff of those optimizations in
real-time by measuring chlorine concentration trends in the catalysts themselves.
Many refinery lab professionals have chosen Petra MAX as their analysis solution to measure D4294 compliant sulfur and 12 other elements including metals and chlorine. Petra MAX is able to measure these elements in hydrocarbons, water, catalysts and carbon-based powders. In this paper, we will conduct a study to demonstrate how Petra MAX is a viable solution to help petroleum professionals optimize their catalyst processes.
To assess the ability of Petra MAX to accurately measure chlorine content in catalyst matrices, we set up an empirical calibration for chlorine in catalyst using six alumina supported catalyst standards. Alumina supported catalysts are commonly used and can be found in most parts of the refinery. The calibration was used to run measurements for a known catalyst check sample.
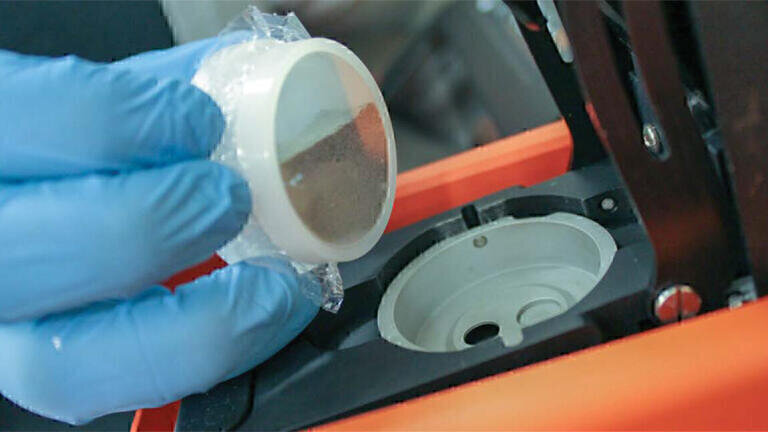
The catalyst samples were ground and prepared in a standard X-ray fluorescence (XRF) cup. For best results, grinding to 325 mesh and tapping the samples on their side is recommended. This is because Petra analyzers utilize a vertical sample introduction which is beneficial as it directs sample spills away from critical components such as the detector and instead towards a drip tray. Tapping the sample helps to compress the powder to eliminate air gaps which impact results.
The resulting calibration curve initially had a correlation coefficient (R2) of 0.99794 (Fig. 1) which is a relatively acceptable value for powder-based samples. However, with Petra MAX, users can fine-tune their empirical calibrations by rerunning specific standards in the curve to improve the linearity of the calibration. After re-prepping the calibration samples using the best practices mentioned above, we remeasured specific points of the calibration to achieve an improved correlation value of 0.99957 (Fig. 2). Petra MAX users can fine-tune their empirical calibrations as many times as needed until they achieve a correlation value that works for their testing needs.
Once we successfully improved our correlation value to better suit our specific measurement needs, we proceeded to measure our known reference sample. We ran the same measurement across a total of 3 Petra analyzers in order to assess accuracy.
For each measurement across all analyzers, we measured 3 repeats at 100 seconds each, with the results of the 3 being averaged. This average is considered a single measurement result. Below we explain why expanding the measurement to include 3 repeat determinations is considered best practice.
XRF analyzers function best when analyzing homogenous samples. For finished liquid hydrocarbon fuels, such as diesel or gasoline, this is generally not an issue. Unfortunately, catalyst is inherently non-homogenous, which is why it is necessary to grind the sample to a fine powder before analysis. Depending on how finely the powder can be ground (325 mesh is recommended), this may not be enough to ensure consistent results, especially if the chlorine is not homogenously distributed in the sample. This is why XOS recommends repeat analysis of the sample, using the following procedure:
• Prepare a catalyst sample using the best practices described above. Tap the sample on its side to compress the powder and eliminate air gaps, then introduce into Petra MAX in the correct orientation (using a vent clip for autosampler analysis).
Measure for 100s.
• Prepare a second sample following the same process as above, or, using the first sample, shake to mix the powder then retap the sample as before. Insert into Petra MAX and measure for 100s.
• Prepare a third sample or reanalyze the first sample again using the procedure above.
• Report the average of the three determinations as the measurement result. This will ensure that the user gets a more accurate value, that is, a value that is more consistent with the true value of the sample.
In the data below, we will illustrate the importance of using this sample preparation and measurement procedure by displaying the 3 individual results and then the average of the 3, which should be consistently closer to the reference value and thus a more accurate result.
RESULTS
Across 3 distinct Petra MAX analyzers, we measured a catalyst sample with a known reference value of 0.98wt% to test for measurement accuracy. A mixture of Petra MAX Autosamplers
and single-sample Petra MAX analyzers were used.
See Note I for best practices when using an autosampler for measuring catalyst samples. For extra interest, we did not grind the sample to the recommended 325 mesh, and instead used a more coarsely ground sample (see Fig 3).
As seen from the data in Table 1, across all 3 analyzers, we demonstrate measurement accuracy. On our first analyzer, our averaged result is an exact match with the known reference standard. Again, we ran 3 distinct measurements and averaged their results to report a single measurement result. As shown across all 3 analyzers, this diligence in measurement technique has paid off, since our individual results tend to vary.
Looking at the results for Analyzer 1, the result for ‘Run 2’ matches the ‘Reference Value’. But, what if we had only measured the sample once? If we had stopped at our first measurement, our result would be 1.03wt%, which is a good result, however, it is still 0.05wt% higher than our reference value. This trend holds true throughout the rest of our data wherein a single result may be close or an exact match to the reference value, but other single results are further off and the average of the 3 yields a more accurate result. The average result for Analyzer 2 (0.96) and Analyzer 3 (1.03) respectively show better accuracy than the individual ‘Run’ results. The average result for Analyzer 2 (0.96) shows an overall improvement of 0.09wt% compared to the ‘Run 1’ (0.87) result. The average result for Analyzer 3 (1.03) shows an overall improvement of 0.02wt% compared to the ‘Run 1’ (1.05) result.
Lastly, as we look at data across all our Petra analyzers and compare the ‘Avg’ column (again, this column represents the one true measurement value for the specific analyzer represented by the row) to the ‘Reference Value’ column, we see accuracy for every analyzer. Notably, in the results shown for Analyzer 1 we have a sample average that is an exact match with our reference value, and the results from Analyzers 2 and 3 show a nominal difference from the reference value. This minimal difference demonstrates that Petra analyzers provide refinery and third-party labs with a reliable method to obtain accurate measurement data for measuring chlorine in catalyst.
PIN 27.3 June/July 2026


-(1).jpg)