Air monitoring
Northern Virginia has become one of the most concentrated data centre regions in the world. In Loudoun and Prince William counties, entire landscapes are now shaped by server halls, cooling systems and backup power infrastructure.
For residents and regulators, that rapid growth has brought a straightforward but difficult question: what does this mean for the air people breathe?
It’s a fair question. Most data centres run cleanly day to day, but they rely on diesel generators and, in some cases, gas turbines during testing and outages. Individually, these events are short-lived. Taken together across a dense cluster of facilities, they become much harder to ignore.
To get a clearer picture, the Virginia Department of Environmental Quality (DEQ), supported by the US Environmental Protection Agency (EPA), launched a targeted air quality monitoring programme in the region.
Traditional regulatory monitoring networks were not designed for this kind of industrial footprint. Data centres don’t behave like factories with steady emissions. They are intermittent, distributed, and often difficult to attribute when something does happen. So the DEQ’s starting point was simple: build a clearer, more localised evidence base.
The focus was on three key pollutants linked to combustion sources:
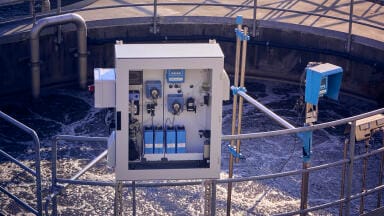
Rather than relying solely on fixed reference stations, the team deployed a distributed sensor network capable of tracking changes in near real time across a wide area. They opted for Kunak AIR Pro stations.
The first phase focused on Loudoun County, often referred to locally as “data centre alley”. The density of facilities there made it the logical starting point for the study.
Instead of a single monitoring site, the DEQ identified 22 potential locations across residential, industrial and mixed-use areas. These included upwind and downwind positions to help understand how air masses move through the corridor.
One sensor was co-located with the DEQ’s regulatory reference station at Broad Run High School in Ashburn, providing an important validation benchmark. Another was positioned near Dulles International Airport to support meteorological comparison.
Each monitoring unit tracks:
All data is transmitted in near real time, giving the DEQ a continuously updated picture of conditions across the study area rather than a static snapshot.
Solar power capability has also made it possible to deploy sensors in locations without grid access, which is particularly important when trying to build a genuinely representative network rather than one limited by infrastructure.
So far, the results are reassuring.
Across all monitoring locations in Loudoun County, pollutant levels have remained below national air quality standards:
Just as importantly, the co-located sensor at the Ashburn reference station has shown good alignment with regulatory-grade measurements, giving confidence in the consistency of the wider network.
In other words, the early picture does not suggest widespread exceedances linked to data centre activity.
One of the most useful aspects of this type of network is not just the pollutant levels themselves, but how they vary across space.
Because emissions from data centres are episodic—linked to generator testing or rare outages—localised monitoring helps distinguish between background pollution and site-specific events.
Over time, this creates something regulators in this sector have rarely had: a baseline that can actually be used to identify change.
The DEQ is also developing a public-facing platform to share network readings in near real time.
For now, data is being published through regularly updated charts, but the intention is clear: make the information accessible without technical barriers.
That matters in a region where public concern has been a major driver of the project. Air quality data is no longer just a regulatory input—it is part of the wider conversation between communities, industry and government.
After the first phase in Loudoun County, the network will move to Prince William County for the next stage of monitoring.
Sensors will be repositioned to extend coverage and test whether similar patterns are seen elsewhere in the corridor.
If any areas show consistently higher readings, the DEQ plans to bring in mobile reference monitoring units for more detailed investigation. That step will help determine whether permanent monitoring stations are needed and where they should be placed.
From a regulatory standpoint, data centres sit in an unusual position. They are large energy users with potential emissions sources, but they do not yet fit neatly into traditional air quality frameworks designed for heavy industry or power generation.
That is part of what makes this programme significant. It is not just measuring pollution; it is helping define how an emerging sector should be monitored in the first place.
With more than 4,000 data centres operating in the US—and demand still rising due to AI, cloud computing and digital services—the question being asked in northern Virginia is unlikely to stay local for long.
Other regions are already watching closely.
What the DEQ is building here is essentially a template: a way to combine sensor networks and reference monitoring to understand an industry that is expanding faster than the rules that govern it.
And in that sense, this is less about one corridor in Virginia—and more about what comes next.
PIN 27.2 Apr/May 2026