Chromatography
Chromatographic techniques underpin analytical workflows across pharmaceutical development, chemical manufacturing, materials science, and environmental analysis. While separation efficiency ultimately defines chromatographic resolution, detector choice governs sensitivity, selectivity, and the depth of chemical information that can be extracted. As analytical challenges increasingly involve complex mixtures, low-level impurities, and chemically diverse components, the limitations of conventional detection strategies have become more apparent.
In gas chromatography (GC), flame ionisation detection (FID) remains the most widely used detector due to its robustness, wide linear dynamic range, and broadly uniform response to organic compounds. However, FID provides no intrinsic chemical or structural information, and analyte identification relies largely on retention time or orthogonal techniques. Mass spectrometry (MS) addresses this limitation by providing molecular and fragment ion information, but at the expense of increased cost, operational complexity, and maintenance burden. These trade-offs have sustained interest in alternative GC detectors that combine broad applicability with chemically informative response.
Vacuum ultraviolet (VUV) detection has emerged in recent years as a distinctive addition to the GC detector landscape. By exploiting absorbance at significantly shorter wavelengths than conventional ultraviolet detection, VUV detection accesses a high–photon energy region in which most organic compounds absorb strongly. Importantly, absorption in this region is also chemically characteristic, enabling near-universal sensitivity together with spectral information that supports compound classification and deconvolution of co-eluting species. Since its commercial introduction, GC–VUV detection has been applied to residual solvent analysis, impurity profiling, and complex mixture characterisation, establishing the technique as a mature and credible alternative to traditional GC detectors.
In liquid chromatography (LC), detector selection presents a different set of challenges. Ultraviolet–visible (UV–Vis) detectors dominate routine LC analysis due to their robustness and quantitative performance, but their applicability is limited to analytes with chromophores absorbing above approximately 200 nm. Many important compounds, including aliphatics, lipids, amino acids, and certain excipients, exhibit weak absorbance in this region. Alternative detectors such as refractive index (RI), evaporative light scattering (ELSD), and charged aerosol detection (CAD) extend applicability but often compromise sensitivity, linearity, or gradient compatibility.
The recent commercial availability of VUV detection for liquid chromatography extends short-wavelength absorbance detection beyond its established GC applications. By providing near-universal absorbance with full spectral acquisition, LC–VUV detection offers a new option for impurity profiling and method development where conventional UV detection is insufficient. Accordingly, this paper focuses primarily on VUV detection in gas chromatography before examining its emerging role in liquid chromatography and its implications for future analytical workflows.
The vacuum ultraviolet (VUV) region spans approximately 10–200 nm, with practical chromatographic detection typically focused on ~120–200 nm. At these wavelengths, photon energies are sufficient to excite σ–σ* and n–σ* electronic transitions common to most organic molecules, resulting in broadly applicable absorbance across compound classes.
In gas chromatography, carrier gases such as helium and hydrogen absorb strongly at shorter VUV wavelengths; as a result, data collection typically begins at approximately 120 nm to avoid carrier gas interference. In liquid chromatography, mobile phases exhibit increasing absorbance at low wavelengths, so detection is generally initiated at higher wavelengths (around 177 nm) to maintain acceptable mobile phase transparency. Recent VUV detector designs extend the measurable range beyond the traditional VUV region into the near-UV, broadening compound coverage and enhancing analytical flexibility.
From an operational standpoint, VUV detectors function analogously to conventional UV photodiode array (PDA) detectors and integrate seamlessly with standard chromatography data systems (CDS).
Sensitivity: Residual solvent and impurity monitoring
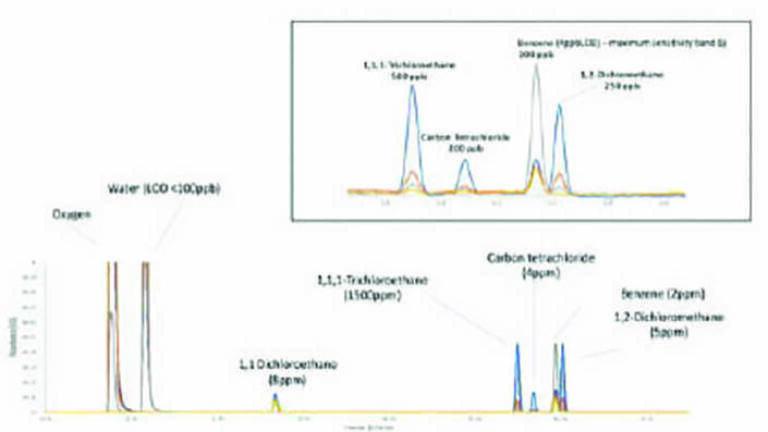
VUV detection provides high sensitivity for residual solvent analysis and impurity monitoring, making it a powerful tool in pharmaceutical development. Residual solvent analysis, governed by USP <467> and ICH Q3C guidelines, is a particularly well-suited application. Using the USP <467> methodology, Class 1, 2, and 3 solvents were evaluated with VUV detection and met all prescribed limits of detection. Class 1 solvents were analysed at both maximum permitted levels and at a three-fold dilution, demonstrating robust and reproducible detection (Figure 1). In an additional experiment the limit of detection for benzene was determined to be 4 ppb.
Many residual solvents, including halogenated and low-molecular-weight organics, absorb strongly in the VUV region, and the associated spectral information enhances compound identification beyond retention time alone.
Figure 1: Enhanced sensitivity Class 1 solvents using VUV Detection (USP 467).
In a separate study, residual solvents and water were quantified simultaneously in a single GC–VUV analysis, eliminating the need for Karl Fischer titration and highlighting the potential for improved laboratory efficiency and analytical throughput.
VUV detection also excels in impurity monitoring for synthetic reactions. In a Suzuki coupling reaction used in the synthesis of valsartan, reaction mixtures from each process step were analysed in parallel using GC–VUV and GC–FID detection. While most impurities were detected by both detectors, VUV revealed an additional impurity not observed by FID. The VUV spectrum suggested that this impurity was process-related and warranted further investigation (Figure 2). Moreover, sensitivity for specific impurities was optimised by selecting targeted wavelength bands, rather than relying on a single averaged response.
Figure 2: Comparative chromatograms of reaction mixtures analysed by VUV and FID.
Analysis of starting material enabled identification of unreacted precursors through retention time matching and spectral comparison with authentic references. Importantly, alternative spectral bands allowed accurate quantification of partially co-eluting impurities without method redevelopment (Figure 3). Together, these examples demonstrate that VUV detection delivers not only low limits of detection, but also increased analytical confidence when monitoring complex reaction mixtures, residual solvents, water, and trace impurities.
Figure 3: Comparative chromatograms by VUV
(band 5, 9 and 10) vs FID detection.
Selectivity: Compound differentiation and spectral fingerprinting
Beyond sensitivity, VUV detection offers enhanced selectivity through compound-specific spectral signatures. Functionally analogous to a UV-PDA detector in liquid chromatography, VUV detectors enable peak purity assessment and method specificity evaluation for GC applications. This capability is particularly valuable for complex samples such as multi-solvent formulations, crude reaction mixtures, pharmaceutical degradation studies, and flavour and fragrance products.
In collaboration with a flavour and fragrance manufacturer, a series of experiments was conducted using authentic standards alongside complex mixed samples. By building a library of reference spectra, impurities were identified through combined retention time and spectral matching. The analysis further revealed that several peaks previously assumed to be pure actually co-eluted with known impurities, exposing limitations in the original method’s specificity. These results demonstrate the ability of VUV detection to confirm impurity identity, assess peak purity, and uncover co-eluting species, thereby improving method robustness and analytical confidence (Figure 4).
* data processed in Openlab
Figure 4: Peak purity and spectral matching for a fragrance sample.
In liquid chromatography, detection is often constrained by the limited chromophoric properties of many analytes. Compounds such as aliphatics, lipids, polymers, amino acids, and certain excipients may exhibit weak or negligible absorbance above 200 nm, necessitating the use of alternative detection techniques such as RI, ELSD, or CAD or chemical derivatisation.
VUV detection extends absorbance-based detection into a spectral region where these compounds absorb more strongly, enabling direct, linear detection without the need for aerosol formation, solvent evaporation or chemical derivatisation.
To demonstrate the sensitivity gains achievable with VUV detection, 21 underivatised amino acids were analysed using detection at 190 nm (Figure 5). All amino acids exhibited measurable absorbance in the VUV region, underscoring the broad applicability of this approach for analytes traditionally considered UV-invisible.
The VUV spectrum of arginine is shown in Figure 6, where a pronounced increase in molar absorptivity is observed as the wavelength decreases into the VUV region. This translated directly into enhanced analytical sensitivity, with an approximately 80-fold improvement relative to conventional UV detection. These results illustrate how VUV detection combines the quantitative robustness and linearity of UV detection with substantially improved sensitivity and analyte coverage, expanding the scope of absorbance-based detection in liquid chromatography.
Figure 5: Chromatography of 21 amino acids detection with VUV at 190nm.
Figure 6: The VUV spectrum of arginine and chromatographic detection by VUV and UV .
Vacuum ultraviolet detection represents a significant advancement in chromatographic detection for both gas and liquid chromatography. By accessing a high-energy spectral region in which most organic compounds absorb, VUV detection delivers near-universal sensitivity while simultaneously providing chemically informative spectral data. In GC applications, this combination enables sensitive residual solvent analysis, improved impurity detection, peak purity assessment, and deconvolution of co-eluting species—capabilities that bridge the gap between non-specific detectors such as FID and more complex techniques such as mass spectrometry.
The extension of VUV detection into liquid chromatography further broadens its analytical impact. By enabling sensitive, linear absorbance detection for compounds with weak or absent chromophores, LC–VUV detection addresses longstanding limitations of conventional UV–Vis detection and reduces reliance on alternative detectors with inherent trade-offs. The ability to acquire full spectral information also supports improved method development, specificity assessment, and impurity profiling.
Collectively, these attributes position VUV detection as a versatile and complementary tool within modern chromatographic workflows. As analytical demands continue to shift toward more complex samples, tighter impurity control, and increased efficiency, VUV detection offers a compelling balance of sensitivity, selectivity, and practicality. Its continued adoption in both GC and LC applications is likely to reshape detector selection strategies and expand the analytical capabilities available to chromatographers across a wide range of industries.
The author would like to thank Dr. Sam Whitmarsh, Director of Analytical Science at Catsci Ltd, as well as Dan Driscol, Ollie Stacy, and Declan McMorrow of UVison Ltd, and Ryan Schonert of VUV Analytics for their valuable contributions and support throughout this work.
PIN 27.2 Apr/May 2026